Note
Go to the end to download the full example code.
Adding a new gallery example#
This example shows how to add a new example to the PyAnsys Sphinx-Gallery. You can use this example as a template for adding your examples.
Each example should have a reference tag/key in the form:
.. _<example-name>_example:.
The .. _ is necessary. Everything that follows is your reference tag, which
can potentially be used within a docstring. All references should be in snake case.
The first section, which is text, provides a brief overview of what the example is. When using this example as a template, you would change the title to an appropriate one for your example.
Add new examples as Python scripts like this:
examples/<index>-<directory-name>/<some-example>.py
Note
Avoid creating directories unless absolutely necessary. If you must
create a directory, make sure to add a README.txt file containing a
reference, a title, and a one-sentence description of the directory.
Otherwise, Sphinx ignores the new directory.
Example file names should use snake case and be hyphen-separated:
some-example.py
After this text section is the first code block. This is where you typically set up your imports.
import pyvista as pv
Section title#
Code blocks can be broken up with text sections, which are interpreted as ReStructuredText.
The text sections are also translated into a markdown cell in the generated Jupyter notebook or in the HTML documentation.
Text sections can contain any information that you may have regarding the example, such as step-by-step comments and notes regarding motivations.
As in Jupyter notebooks, if a statement is unassigned at the end of a code
block, output is generated and printed to the screen according to its
__repr__ method. Otherwise, you can use the print() function to output text.
# Create a dataset and exercise its ``__repr__`` method

dataset = pv.Sphere()
dataset
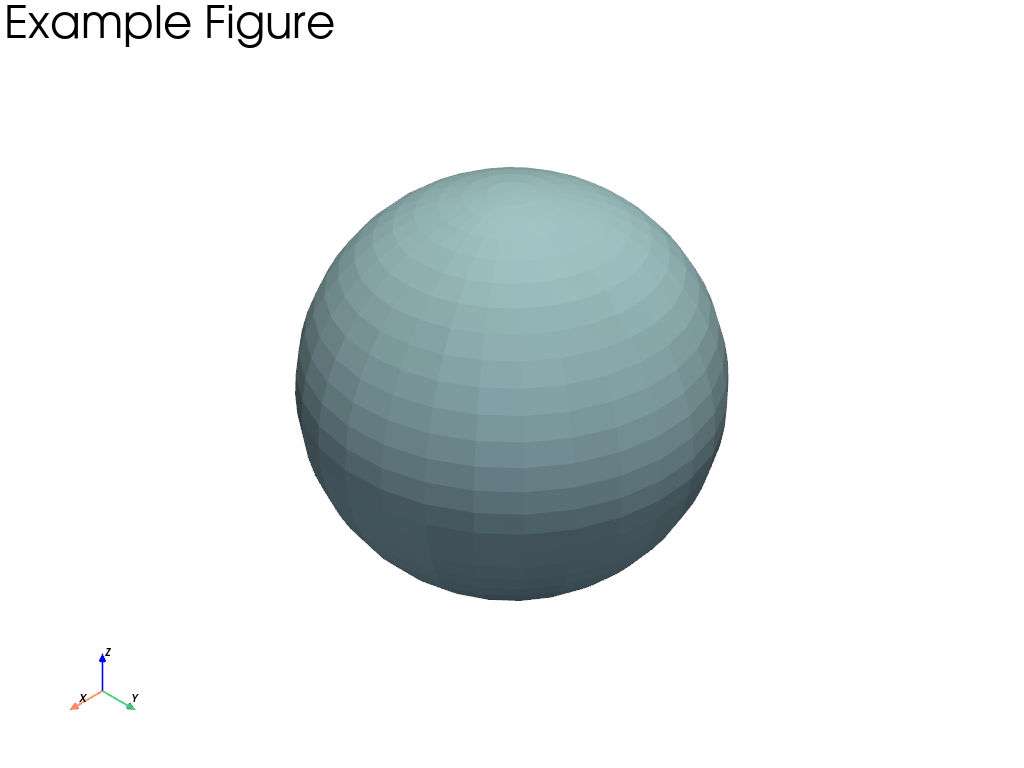
Plots and images#
If you use anything that outputs an image (for example, the
pyvista.Plotter.show() function), the resulting image is rendered in the
HTML documentation.
Note
Unless sphinx_gallery_thumbnail_number = <int> is included at the top
of the example script, the first figure (this one) is used for the
gallery thumbnail image.
Also note that this image number uses one-based indexing.
dataset.plot(text="Example Figure")
Caveat - plotter must be within one cell#
It’s not possible to have a single pyvista.Plotter object across
multiple cells because these are closed out automatically at the end of a
cell.
This code exercise the pyvista.Actor repr to demonstrate
why you might want to instantiate a plotter without showing it in the same
cell:
pl = pv.Plotter()
actor = pl.add_mesh(dataset)
actor
Actor (0x7f408df36da0)
Center: (0.0, 0.0, 0.0)
Pickable: True
Position: (0.0, 0.0, 0.0)
Scale: (1.0, 1.0, 1.0)
Visible: True
X Bounds -4.993E-01, 4.993E-01
Y Bounds -4.965E-01, 4.965E-01
Z Bounds -5.000E-01, 5.000E-01
User matrix: Identity
Has mapper: True
Property (0x7f408f04bb80)
Ambient: 0.0
Ambient color: Color(name='light_blue', hex='#add8e6ff', opacity=255)
Anisotropy: 0.0
Color: Color(name='light_blue', hex='#add8e6ff', opacity=255)
Culling: "none"
Diffuse: 1.0
Diffuse color: Color(name='light_blue', hex='#add8e6ff', opacity=255)
Edge color: Color(name='black', hex='#000000ff', opacity=255)
Edge opacity: 1.0
Interpolation: InterpolationType.FLAT
Lighting: True
Line width: 1.0
Metallic: 0.0
Opacity: 1.0
Point size: 5.0
Render lines as tubes: False
Render points as spheres: False
Roughness: 0.5
Show edges: False
Specular: 0.0
Specular color: Color(name='light_blue', hex='#add8e6ff', opacity=255)
Specular power: 100.0
Style: "Surface"
DataSetMapper (0x7f408f04bb80)
Scalar visibility: False
Scalar range: (0.0, 1.0)
Interpolate before mapping: True
Scalar map mode: default
Color mode: direct
Attached dataset:
PolyData (0x7f4098b5bac0)
  N Cells:    1680
  N Points:   842
  N Strips:   0
  X Bounds:   -4.993e-01, 4.993e-01
  Y Bounds:   -4.965e-01, 4.965e-01
  Z Bounds:   -5.000e-01, 5.000e-01
  N Arrays:   1
This cell cannot run the plotter#
Because the plotter is already closed by Sphinx-Gallery, the following code would raise an error:
>>> pl.show()
# You can, however, close out the plotter or access other attributes.

pl.close()
Create a pull request#
Once your example is complete and you’ve verified that it builds locally, you can create a pull request.
Branches containing examples should be prefixed with docs/ as per Branch-naming conventions.
Note
You only need to create the Python source example (PY file). Sphinx-Gallery automatically generates the Jupyter notebook and the RST file for generating the HTML documentation page.
Total running time of the script: (0 minutes 5.316 seconds)